What Is WAR In Baseball? (Answered In Detail)
It seems that numbers play a bigger role in baseball than any other major sport.
With each team playing 162 regular-season games every year, there’s plenty of data available for statisticians to interpret the game in many ways and derive all sorts of player evaluations and comparisons.
Statistics are often used in heated arguments between fans and relied on by front offices when making franchise-altering decisions.
Still, most traditional stats usually fall short when it comes to providing a complete evaluation of certain players.
This was the reason for the development of advanced statistics and sabermetrics as an attempt to deliver a more precise and quantifiable measure of a player’s performance.
One of the metrics that is frequently mentioned in these conversations and often emphasized by front-office executives is WAR.
Below, I’ll explain what is WAR in baseball and how it works to provide an assessment of players’ value.
So, let’s dive in!
Table of Contents
What Is WAR In Baseball?
In baseball, WAR stands for Wins Above Replacement.
Sometimes referred to as a WARP (Wins Above Replacement Player), WAR is a metric measuring how much better (or worse), a specific player is over a typical average player.
More precisely, WAR indicates how many more wins (or losses) a team would have with that player than with the replacement-level player put in his place.
For example, if a player’s WAR is 2.5, that means that his team would have roughly 2.5 wins less if he were replaced with a fictional replacement-level alternative.
As you can see, WAR is represented in the form of a single number.
However, that number is calculated by considering all the most significant aspects of a ballplayer’s game, such as hitting, running, fielding, pitching, etc.
In addition, WAR takes into account the player’s position, making it possible to compare players in different roles on the baseball field.
What Is A Replacement-Level Player?
Before moving on, we should deal with the concept of replacement-level player, which is probably the WAR-related thing that confuses people the most.
WAR basically works by assigning the value to an average Minors player and determining how much better a specific MLB player is compared to his theoretical minor-league alternative.
The replacement-level player is supposed to represent the baseline production used to calculate WAR.
It’s the expected production if the evaluated player was replaced with a run-of-the-mill minor-leaguer.
Simply put, it’s a hypothetical average contribution by a minor league or bench player that can be acquired for free or at a minimal cost.
Baseball-Reference determines replacement level at a .294 winning percentage (48-114 season record).
This is the winning percentage hypothetically expected of a team constructed solely of replacement-level players.
This level may occasionally change, but only in extreme cases, such as during shortened seasons or during WWII.
How Is WAR Calculated?
Unlike more simple stats, such as ERA, WHIP, or OPS, which are rather straightforward, the calculation of WAR includes many different factors and adjustments.
In addition, there are a couple of slightly different methods of calculating WAR. but more on that later.
The great thing about WAR is that it allows us to compare pitchers and position players.
However, due to the very different nature of their responsibilities and roles on the field, the WAR for each of them is calculated differently.
Even though these calculations may seem simple at their core, there are numerous steps to take before determining the precise WAR value.
This is why WAR calculations are not done by average fans. It’s also the reason why some statisticians disagree on the best ways to reach the end result.
Calculating WAR For Position Players
The MLB has adopted the formula for calculating WAR for position players which looks like this:
The number of runs above average a player is worth in his batting, baserunning and fielding + adjustment for position + adjustment for league + the number of runs provided by a replacement-level player) / runs per win
As you can see, the formula sums up the player’s run performance (wins) in batting, running, and fielding, before factoring in various adjustments and adding replacement runs to compare the player’s performance to the replacement level.
The result is Runs Above Replacement (RAA) which is then converted to WAR using the runs-to-wins ratio (commonly 10 runs = 1 win).
The formula may differ a bit depending on the method, but the basics are mostly the same.
To make things a bit more clear, we’ll take a look at these main components of Runs Above Replacement.
Runs Batting
Runs Batting or RBat measure how effective a position player is while hitting. The RBat number shows how many runs the particular hitter is above or below the average.
As in this part of the calculation, the hitter is compared to the MLB average rather than the replacement-level player, it’s not unusual for this value to be negative.
Even some Hall-of-Famers had a negative Runs Batting value.
The league average is adjusted every season depending on the offensive numbers that year. RBat makes the difference between batted outs and strikeouts, infield and outfield singles.
Runs Baserunning
Baserunning Runs (Rbr) indicates how many runs below or above the average a certain player was on basepaths.
The number factors in stolen bases and times the player was caught stealing, but also how good a baserunner is in taking extra bases and outs on basepaths.
Runs Fielding
Runs Fielding or Rfield determines how many runs a position player was in the field compared to the league average.
Similar to Runs Batting, as the comparison is to the MLB average, this number is often negative.
Being the number that considers a player’s defense, this is one of the most complicated stats used to calculate a position player’s WAR.
It’s determined by taking into account no less than 8 different factors. When calculated properly, it should show how many runs a player’s defense costs or saves his team.
Runs Grounding Into Double Plays
Runs Grounding into Double Plays or Rdp indicates how good a player is in avoiding double plays.
As double play situations are not so common, Rdp has less of an influence on overall WAR compared to Runs batting, baserunning, or fielding.
Nevertheless, knowing how damaging a double play can be, it still sits in its own category.
It’s significant as an indicator of how many double plays a player hits into whenever he hits a groundball with at least one out and a runner on the first with no more than one out.
Positional Adjustment Runs
Positional Adjustment Runs or Rpos take into account the defensive position the evaluated player occupies on the field and makes the adjustment based on that position.
In an otherwise very objective methodology, this is the most subjective factor as it considers how difficult each position is to play.
Based on that Rpos assigns positive or negative multipliers.
Replacement-Level Runs
Replacement-Level Runs or Rrep is nothing more than a level of additional runs for the evaluated player compared to the replacement-level alternative.
It’s based on playing time and plate appearances only, so the number is always positive. Rrep values the ability to suit up for every game.
Calculating WAR For Pitchers
WAR calculation for pitchers may seem a bit less cluttered than the one used for positional players, as it focuses on two main inputs – pitching and fielding.
At the most basic level, it only requires Runs Allowed and Innings Pitched.
However, to properly assess the pitcher’s value, the calculation has to determine how effective he is in different circumstances and adjust for that context.
So, the pitcher’s WAR will have to factor in several smaller sub-categories.
RA9
RA9 is rather straightforward and easy to understand.
It’s simply the number of runs the pitcher allows per 9 innings. RA9 is basically the same as ERA, with the exception that it also counts unearned runs.
xRA
xRA indicates the average number of runs scored by the team the pitcher is playing against, per 9 innings.
As not all opponents are the same, with some luck, a pitcher can have a great year by avoiding offensive juggernauts, or vice-versa.
However, over a longer period, these things usually even out.
xRA_def
xRA_def shows runs per 9 innings that come as a result of support from the pitcher’s defense.
It paints a wider picture of the pitcher’s performance as it puts it in the context of the team’s overall defensive performance.
Very poor or extremely good team defense can result in surprisingly high or low WAR for a certain pitcher.
xRA_sprp
RA9role is used to put more emphasis on the pitcher being a starter rather than just a reliever.
PPFp
PPFp factors in different conditions at different ballparks and adjusts for them.
As starting pitchers don’t play in every game, with a bit of luck and a good schedule, they may have a disproportionate number of starts at pitcher-friendly fields.
Or, vice-versa.
xRA_final
The calculation of factors that go into the pitcher’s performance results in xRA_final.
Using the data dating back to 1918, xRA takes into account and separates players based on the league they play in (American or National), removes the stats associated with their team, and adjusted for interleague games, ballpark factors, and the pitcher’s team’s defense.
The formula for xRA_final looks like this:
xRA_final = PPF_custom * (xRA – xRA_def + xRA_sprp_adj)
WAA
WAA is the Wins Above Average number for pitchers calculated by converting runs (xRA_final) to wins.
WAA_adj
WAA_adj is a leverage index that assigns value to each particular situation the pitcher may find himself during the game.
For example, closing pitchers are often used in higher-leverage situations than starters or mid-relievers.
WAR_rep
Similar to Replacement-Level Runs for hitters, WAR_rep is used to set the replacement level for pitchers in each league.
With all these factors known the WAR for pitchers is calculated using the following formula:
WAR = WAR_rep + WAA + WAA_adj
Different Methods Of Calculating WAR In Baseball
The two of the most popular methods of calculating WAR were devised by forefront statistic websites – Baseball-Reference and FanGraphs.
Each of them uses a slightly different formula and the examples used above are from the Baseball-Reference method which is a bit more popular.
Commonly, two approaches will produce similar results, placing comparable value on evaluated players.
Baseball-Reference’s calculation is referred to as bWAR, while fWAR stands for the FanGraphs’ method.
While the two methods had some significant differences, in 2013, the two sites unified the replacement levels across their WAR calculations.
Right now, the rare major differences are in the defensive metrics used and the handling of balls in play for pitchers.
bWAR uses RA9 as the basis for the pitcher’s WAR, while fWAR focuses on FIP (infield fly balls).
What Is A Good WAR In Baseball?
Once you gained some sense of what is WAR in baseball, the next step is to understand what value of WAR is considered to be good (or bad).
As it’s the metric pretty much allocated on a per-game basis, WAR may vary and be influenced by some uncontrollable factors, such as season length.
Nevertheless, in the standard season, it’s not too hard to establish a threshold of what is a good WAR.
The majority of players, in any season, will have WAR with a value somewhere between -1.0 and 1.0.
However, this includes a great number of players who play only sparingly.
For full-time position players, the average WAR is around 2.0, as it is for the average starting pitchers.
Bench players and relief pitchers rarely crack 1 WAR.
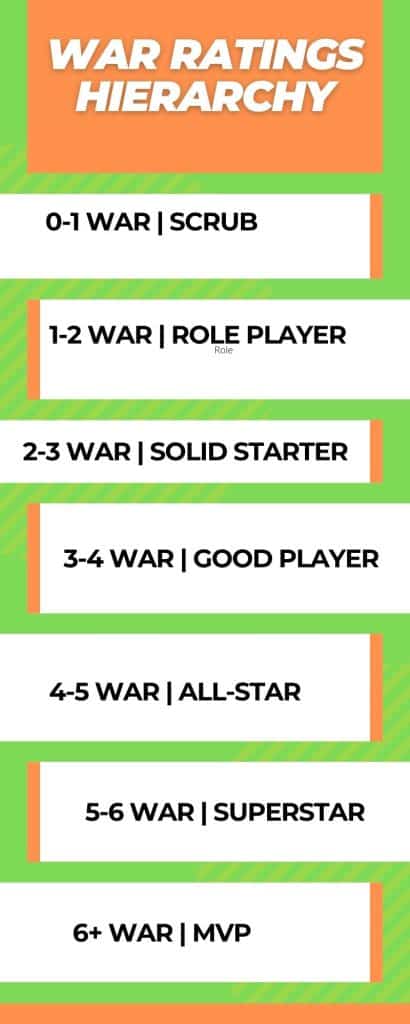
Fangraphs site features a handy chart for the WAR value of starting pitchers and position players. It looks something like this:
WAR Ratings Hierarchy
What Makes WAR So Useful In Baseball?
While many people still have their reservations about WAR, this is mainly because it is often difficult to comprehend and often ambiguous.
However, almost every front office, no matter their doubts, will use WAR at some point during their evaluation of a player and making roster decisions.
Simply, there’s no other stat that is so encompassing and that determines a player’s value to the team from every possible aspect.
It factors in player’s production at the plate, on defense, and running the bases, and even enables comparing position players to pitchers.
No other available stat can do all this.
Traditional stats often fail to account for different conditions the games are played in and different opponents, but WAR adjusts for all these factors.
It allows a fair comparison between players across the leagues and different positions. WAR even provides a tool for comparing players from different eras.
Who Has The Highest WAR In Baseball History?
The highest WAR in a single season was achieved in 1913 by Walter Johnson, Washington Senators’ pitcher, with 15.1 WAR.
He also recorded the second-best pitching season the year before, with 13.2 WAR.
The record among the position players belongs to Babe Ruth, who posted 14.1 WAR in 1923. Among the top ten scores for the position players, five of them belong to Babe Ruth.
When it comes to the highest career WAR, Babe Ruth, unsurprisingly, leads the way with 183.1 career WAR.
- Babe Ruth – 183.1
- Walter Johnson – 164.8
- Cy Young – 163.6
- Barry Bonds – 162.7
- Willie Mays – 156.1
- Ty Cobb – 151.5
- Hank Aaron – 143.1
- Roger Clemens – 139.2
- Tris Speaker – 134.7
- Honus Wagner – 130.8
Criticism Of WAR
Of course, WAR also has its critics. They frequently mention its bias towards players from earlier eras.
As the skill variance was much greater back then, the best players were much better than replacement level than they’re now.
This boosted their WAR ratings, while modern players have much more trouble separating themselves from their peers.
Indeed, the historic WAR lists are dominated by the players from the earlier eras of baseball. Another objection is that WAR doesn’t always take into account performance in critical situations.
An example of this is the 2012 AL MVP race.
Jose Altuve had only a slight WAR advantage over Aaron Judge even though he performed significantly better in high-stakes circumstances.
Conclusion
Fans often obsess about statistics and use it as a crucial argument in endless debates about which player is better.
Stats also serve more serious purposes, as front offices commonly use them when making personnel decisions.
However, despite all this, no stat is perfect. Proper evaluation of a player and his performance is extremely difficult.
Still, WAR definitely comes pretty close.
It may not be as popular or widespread as some other stats, but it surely beats them when it comes to measuring the overall ballplayer performance.
The best thing is that statisticians constantly work on improving their calculation methods, so we can expect WAR to become even more precise and valuable in the future.